Tell us about the job
Takes about a minute. No obligation.
Gas service decides more about a water heater install than the tank size alone. Utility gas heats more occupied homes in Pima County, Arizona than any other fuel, at 50.8% (2020-2024 ACS 5-year). That majority means a replacement unit in most Pima County homes is a gas appliance, which puts venting, combustion air supply, and gas line capacity on the contractor's checklist before anything else gets priced. A unit installed without verifying those conditions can run short on combustion air or vent inadequately, and neither problem shows up immediately. The contractor establishes what the existing setup can support, then sizes the replacement to it.
Ductwork and plumbing runs laid down for equipment that predates what contractors install today were sized for different loads, and in Pima County a significant share of the housing reflects exactly that gap. Half the homes in Pima County, Arizona were built in 1986 or earlier (2020-2024 ACS 5-year). A contractor quoting a water heater installation here looks at what the existing infrastructure will actually carry before the new unit enters the conversation. If the supply lines, venting path, or electrical service at the point of installation were put in for something smaller or differently configured, the scope of the job changes before any equipment is priced.
What a Water Heater Installation Covers
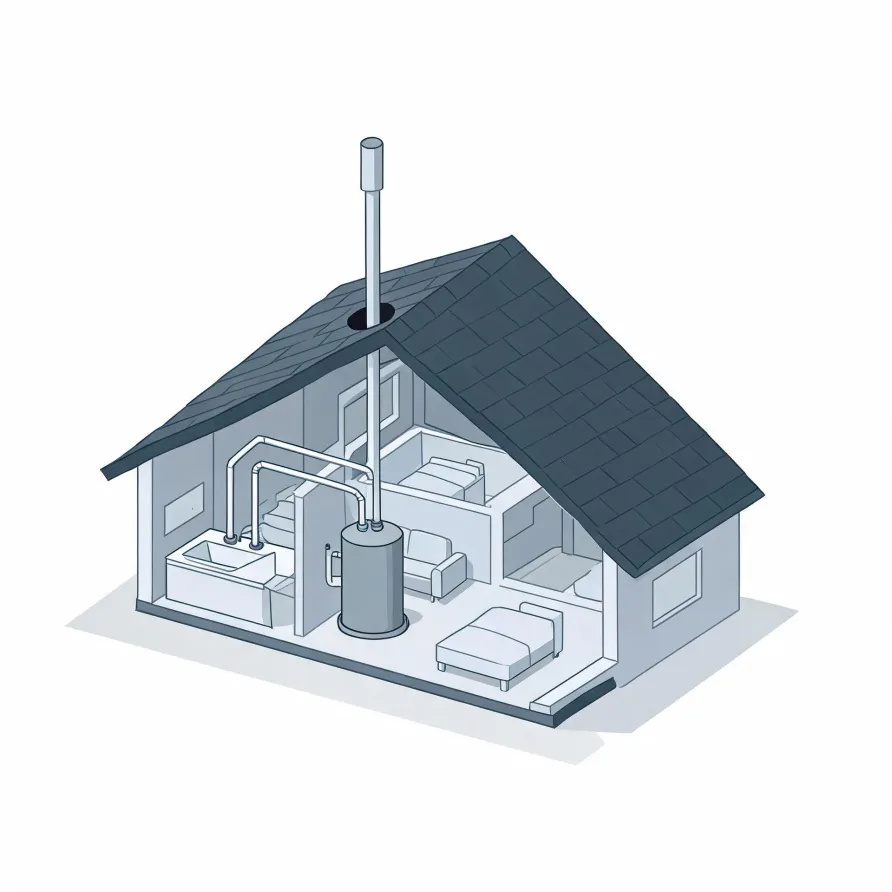
The tank or tankless unit is the centerpiece of the system, sitting in a utility closet, basement, or garage and holding or heating the water your household draws on daily. Attached to it are the inlet and outlet connections that bring cold water in and send hot water out through the supply lines running to every fixture.
A pressure relief valve mounts directly on the unit and vents to a drain line as a safety measure. The flue or exhaust vent runs from the unit up and out of the house, and the gas line or electrical connection feeds the burner or heating element that does the actual work.
The drawing shows a representative layout, and a licensed contractor determines what applies to the specific setup in your home.
Find a contractor in Pima CountyPima County, by the numbers
405 severe weather events were recorded in Pima County, Arizona between 2015 and 2024.
NOAA National Centers for Environmental Information, Storm Events Database, bulk CSV export, events 2015-01-01 through 2024-12-31.Half the homes in Pima County, Arizona were built in 1986 or earlier (2020-2024 ACS 5-year).
U.S. Census Bureau, 2020-2024 American Community Survey 5-Year EstimatesPima County, Arizona holds 479,939 housing units (2020-2024 ACS 5-year).
U.S. Census Bureau, 2020-2024 American Community Survey 5-Year EstimatesOwners occupy 65.2% of the occupied homes in Pima County, Arizona (2020-2024 ACS 5-year).
U.S. Census Bureau, 2020-2024 American Community Survey 5-Year EstimatesSevere Weather Events in Pima County
Pima County's climate puts real demands on water heaters, which run harder and wear faster when outdoor conditions push against them. How often severe weather rolls through here shapes how much strain local equipment absorbs over its life.
405 severe weather events, 2015–2024. Source: NOAA National Centers for Environmental Information, Storm Events Database.